
AI Risk Indicators for Senior Management: Designing a Practical KRIs Dashboard
A useful AI risk dashboard is not a wall of technical metrics. It gives management a clear view of changing risk exposure, emerging vulnerabilities, and the actions required. Key risk indicators (KRIs) signal changes in risk exposure, while key performance indicators (KPIs) measure operational performance. A single metric can serve both purposes, depending on how it is interpreted and the decision it supports. The right indicators depend on each AI system’s intended use and its potential customer, operational, and compliance impacts.
Senior leaders need more than a red, amber, or green status. They need to know what a threshold signals, who owns the response, and whether the information supports a decision. This article explains how KRIs work in enterprise risk management, how to select indicators and set meaningful thresholds, and what a practical dashboard suite can show across AI, operational, compliance, and technology risks. It also explains how to keep dashboards informative without letting a flood of metrics obscure the risks that matter most.
Table of Contents
What are Key Risk Indicators (KRIs) in Enterprise Risk Management (ERM)?
KRIs indicate changes in potential risk exposure, while KPIs measure operational performance against a goal. One metric can serve both functions depending on its context and interpretation. A KRI dashboard connects each signal to a defined risk relationship, data source, measurement period, threshold or trigger, accountable owner, and expected response.
Continuous AI Risk Monitoring
Continuous monitoring uses dashboard signals to show how an AI system’s risk profile changes after deployment. A linked KRI dashboard matters because separate technical measures can obscure enterprise exposure. To build it, identify material risks, select indicators, assign data sources and owners, then define thresholds and escalation paths. Critical systems may require real-time monitoring; other intervals should reflect system use, impact, and controls. Executives need exposure summaries, while technical teams need diagnostic detail.
KRI Thresholds and Reporting
A KRI threshold marks a level of change that warrants attention or action. Set it according to the institution’s risk appetite and the AI system’s purpose, rather than adopting a universal limit. For example, a sustained increase in model error rates may indicate deteriorating performance, while a rise in substantiated customer complaints may signal potential harm or control weaknesses. Each signal should be assessed in context before management determines whether escalation is warranted. Reports should show the measure, trend, threshold status, owner, and response, helping leaders distinguish an emerging signal from a resolved issue.
Security, Privacy, and Compliance Monitoring
AI security and privacy indicators can monitor vulnerabilities such as unusual access, data-quality exceptions, or unauthorized disclosure. Technical teams can investigate an event, while executives assess potential operational and customer impact. Compliance monitoring can track control gaps related to obligations such as the EU AI Act, where applicable. Link each alert to supporting evidence, an accountable response, and the affected system instead of relying on a status color alone.
Framework Guidance for AI Indicators
NIST AI RMF and ISO/IEC 42001 can inform how organizations structure AI risk identification and monitoring; neither establishes one universal set of KRIs. Use these frameworks as reference points when linking each indicator to a defined risk, data source, accountable owner, and management decision. The dashboard should also be revisited when system purpose, data, or controls change. It supports, but does not replace, risk assessment, management judgment, or legal and regulatory compliance.
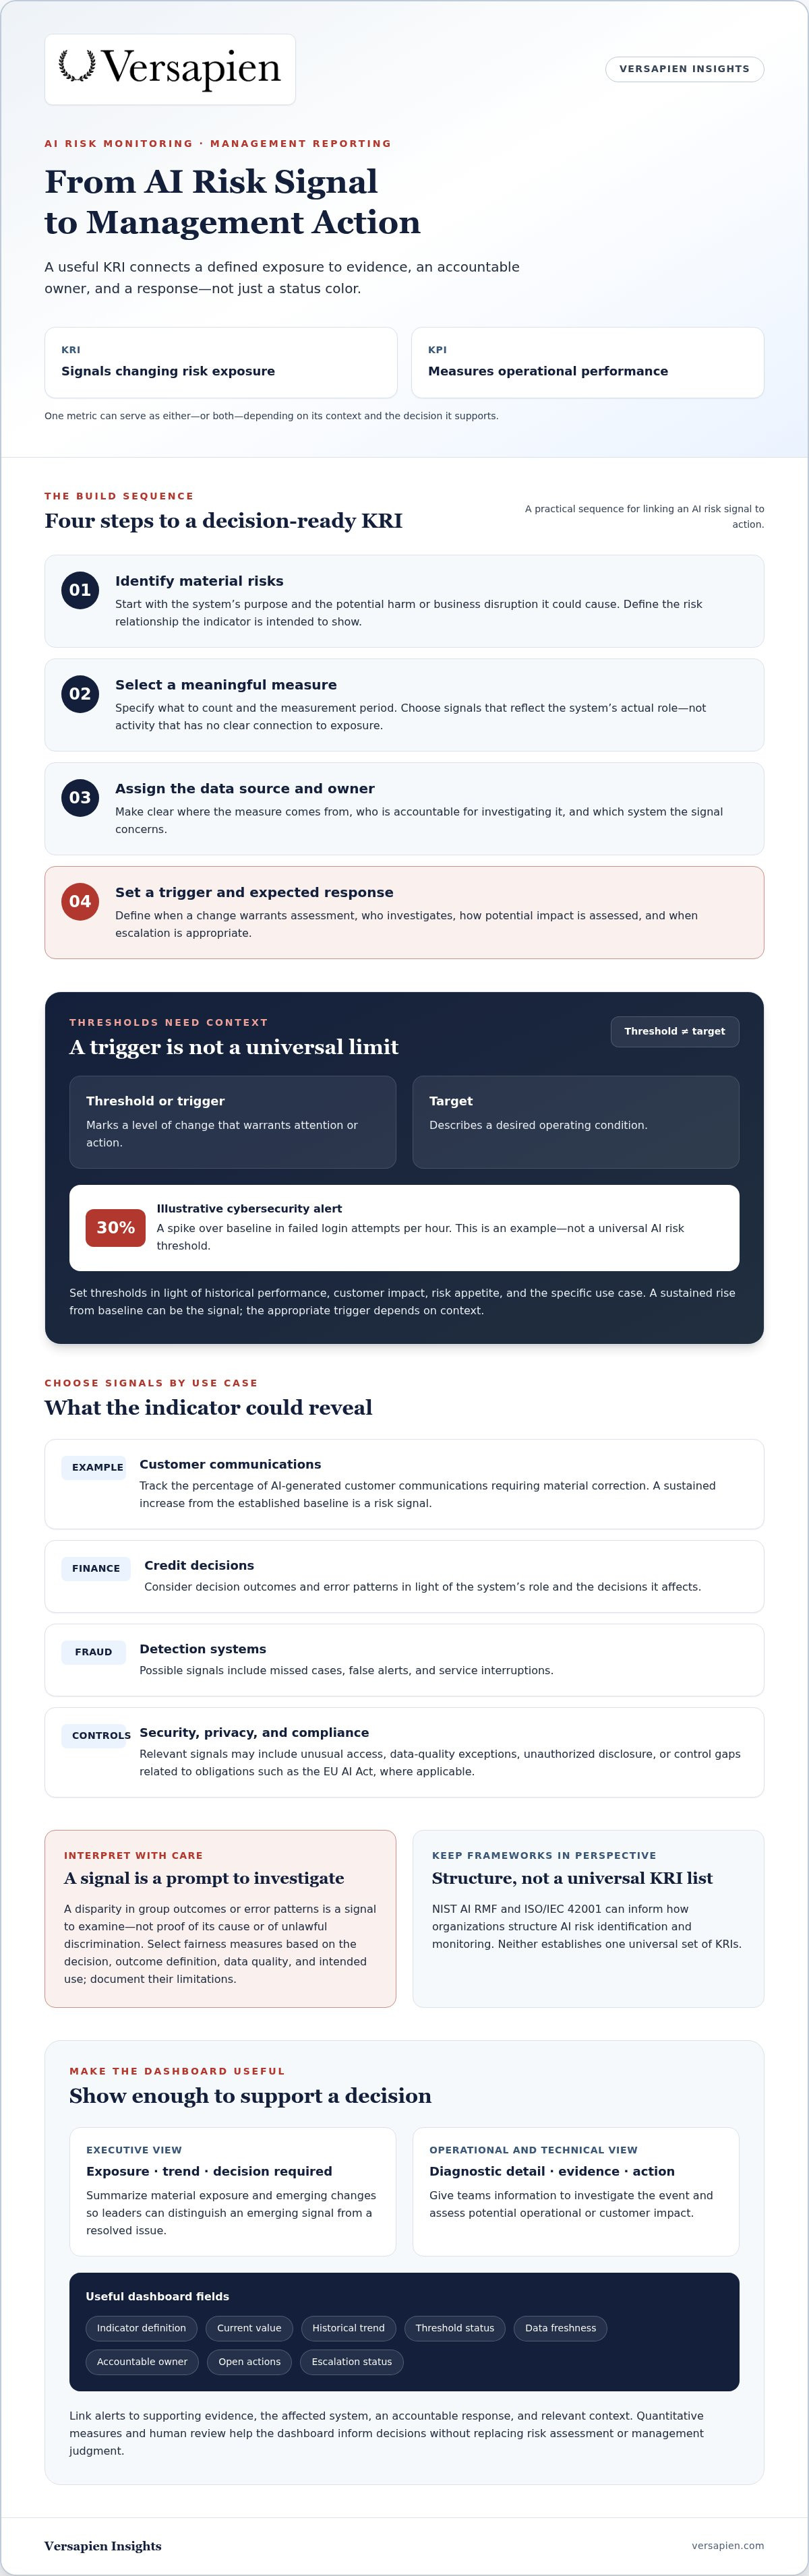
Examples of risk indicators and thresholds
Useful KRIs measure a defined exposure, not simply activity. Their meaning depends on the AI system’s purpose, the decisions it affects, and the organization’s risk appetite.
Defining Measurable AI KRIs
A measurable KRI specifies the defined risk relationship, what to count, the data source, the measurement period, the threshold or trigger, the accountable owner, and the expected response. For example, an indicator could be the percentage of AI-generated customer communications requiring material correction. A sustained increase from the established baseline is the risk signal. The threshold should be determined by historical performance, customer impact, risk appetite, and the specific use case—not a universal standard. The designated business or system owner should investigate the root cause, assess customer impact, and escalate appropriately.
Industry and Use Case Differences
AI indicators vary because potential harms differ by use case. A financial institution assessing credit decisions might monitor decision outcomes and error patterns; a fraud detection system might track missed cases, false alerts, and service interruptions. Leaders should consider how each signal could affect customers, operations, or compliance, then select categories that reflect the system’s actual role.
Bias, Fairness, and Discrimination Metrics
Fairness indicators can compare outcomes or error patterns across relevant groups when the data and decision context support meaningful comparisons. Choose measures based on the outcome being assessed, data quality, and intended use; no single metric guarantees fairness or legal compliance. A disparity is a signal to investigate, not proof of its cause or of unlawful discrimination. Document the interpretation and its limitations.
Thresholds, Targets, and Escalation
A threshold signals when a KRI requires assessment; a target describes a desired operating condition. For example, a 30% increase over baseline in failed login attempts per hour could serve as an illustrative cybersecurity alert, not a universal AI risk threshold. Establish thresholds using relevant historical data, risk appetite, potential impact, and the system’s specific use case. Define severity-based escalation paths, accountable owners, and expected actions so that alerts lead to timely investigation and appropriate response.
Key risk indicator dashboard suite
A useful suite connects portfolio-level exposure with system-level signals, such as a fraud model’s missed alerts and service interruptions. An AI risk dashboard brings these signals into a shared view, helping management connect risk exposure, performance, ownership, and action.
Dashboard Suite Components
A dashboard suite organizes related views for executives, risk owners, and operational and technical teams. Effective dashboards should capture indicator definitions, current values, historical trends, threshold statuses, data freshness, accountable owners, open actions, and escalation statuses where appropriate. High-level executive reporting should summarize material exposure, trends, and decisions required; operational and technical diagnostic views should provide the detail needed to investigate incidents, dependencies, and control evidence. Missing or stale data must be flagged and must not be interpreted as evidence that risk is stable.
Portfolio: AI inventory, business purpose, and risk ownership.
Performance: error rates, latency, and missed service commitments.
Security: access anomalies, vulnerabilities, and incident status.
Governance: open actions, approvals, and evidence of review.
For example, a portfolio summary can flag a recurring outage, while a technical view traces it to a specific service or dependency.
AI Risk and KPI Monitoring Tools
Monitoring tools can combine operational telemetry, application logs, data-quality checks, incident records, and reporting systems. Model observability tools can reveal changes in model behavior; security monitoring can detect unusual access; business intelligence tools can show trends alongside KPIs. KRIs indicate changing risk exposure, whereas KPIs measure operational performance, although one metric may serve both purposes depending on context. The right combination depends on the system architecture, available data, and who needs to act.
A well-designed dashboard links an alert about rising latency to the affected service, business impact, and response owner. Continuous monitoring also relies on dependable data feeds: the dashboard should flag stale or missing inputs rather than suggest that an unreported metric is stable. These capabilities give executives the context needed for decisions and provide technical teams with a starting point for investigation. Dashboards complement, but do not replace, formal risk assessments, management judgment, or compliance with applicable legal and regulatory obligations.
Executive Takeaways
Align indicators with the AI system’s purpose and potential impact.
Distinguish changing risk exposure from operational performance, recognizing that one metric may serve both functions depending on context.
Assign owners who can investigate signals, assess impact, and act on findings.
Set thresholds according to risk appetite and the specific use case, then review whether dashboard information supports timely management decisions.
Revisit indicators when system use, data, or controls change; dashboards do not replace risk assessment, managerial judgment, or legal and regulatory compliance.
How Versapien Can Help
Versapien can help financial institutions assess AI risk governance and develop practical approaches to indicator selection, reporting, and accountability. Through its AI and Digital Transformation Services, Risk Management Consulting, and Regulatory Compliance Advisory, Versapien can support the design of indicators, ownership, escalation paths, and reporting that reflect an organization’s AI use cases and risk appetite. This work can connect dashboard design with existing risk processes and management decision rights, helping leaders turn signals into accountable action.



Comments